
This tutorial demonstrates how to create Scatter Plot by Graph Panel using two different data sources: PostgreSQL datasource and DataInsight datasource.
Dashboard Version: Version 3.0.32

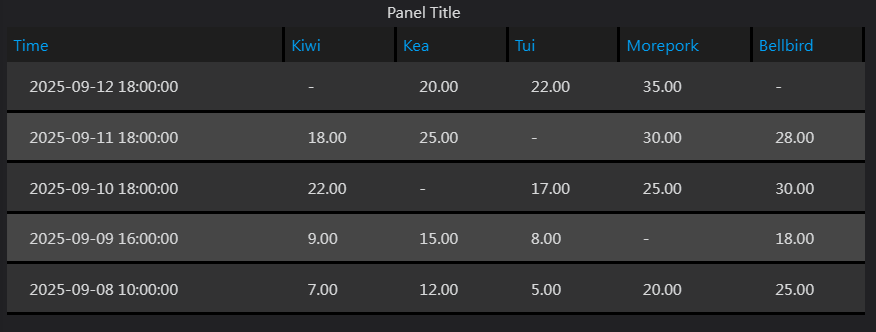
This table represents counts of different bird species with timestamps:
Case 1: From PostgreSQL datasource

# SQL Query

SELECT
  UNNEST(ARRAY[
    to_timestamp('2025-09-08 10:00:00', 'YYYY-MM-DD HH24:MI:SS'),
    to_timestamp('2025-09-09 16:00:00', 'YYYY-MM-DD HH24:MI:SS'),
    to_timestamp('2025-09-10 18:00:00', 'YYYY-MM-DD HH24:MI:SS'),
    to_timestamp('2025-09-11 18:00:00', 'YYYY-MM-DD HH24:MI:SS'),
    to_timestamp('2025-09-12 18:00:00', 'YYYY-MM-DD HH24:MI:SS')
  ]) AS "time",
  UNNEST(ARRAY[7, 9, 22, 18, NULL]) AS "Kiwi",
  UNNEST(ARRAY[12, 15, NULL, 25, 20]) AS "Kea",
  UNNEST(ARRAY[5, 8, 17, NULL, 22]) AS "Tui",
  UNNEST(ARRAY[20, NULL, 25, 30, 35]) AS "Morepork",
  UNNEST(ARRAY[25, 18, 30, 28, NULL]) AS "Bellbird"
Case 2: From DataInsight datasource

# SQL Query

SELECT
    (unix_timestamp('2023-08-10 10:00:00', 'yyyy-MM-dd HH:mm:ss') - 8 * 3600) * 1000 AS time,
    5  AS `Taiwan Hwamei`,
    10 AS `Common Kingfisher`,
    2  AS `Taiwan Scimitar Babbler`,
    36 AS `Taiwan Bush Warbler`,
    39 AS `Styan's Bulbul`,
    40 AS `Crested Bunting`

UNION ALL

SELECT
    (unix_timestamp('2023-08-11 16:00:00', 'yyyy-MM-dd HH:mm:ss') - 8 * 3600) * 1000,
    13,
    NULL,
    10,
    NULL,
    NULL,
    NULL

UNION ALL

SELECT
    (unix_timestamp('2023-08-12 18:00:00', 'yyyy-MM-dd HH:mm:ss') - 8 * 3600) * 1000,
    49,
    15,
    NULL,
    10,
    52,
    7

UNION ALL

SELECT
    (unix_timestamp('2023-08-13 18:00:00', 'yyyy-MM-dd HH:mm:ss') - 8 * 3600) * 1000,
    NULL,
    NULL,
    80,
    67,
    35,
    87

UNION ALL

SELECT
    (unix_timestamp('2023-08-14 18:00:00', 'yyyy-MM-dd HH:mm:ss') - 8 * 3600) * 1000,
    NULL,
    30,
    70,
    NULL,
    NULL,
    NULL
Graph Panel Settings

